Virginia's Regional Gaming Venues Display Distinct Monthly Earnings Shifts Per Commission Figures
Written by Klara Brooks · Jul 29, 2026

Virginia's Regional Gaming Venues Display Distinct Monthly Earnings Shifts Per Commission Figures
Virginia Lottery Commission reports have started outlining earnings patterns at the state's five operating casino locations, and observers note steady fluctuations tied to seasonal visitor volumes along with local economic conditions. Data covers venues in Bristol, Danville, Norfolk, Portsmouth and Richmond where gross gaming revenue figures receive monthly tracking through standardized reporting requirements. Those who've followed these releases see how each site responds differently to factors such as nearby tourism draws and competing entertainment options.
Overview of Reported Earnings Across Sites
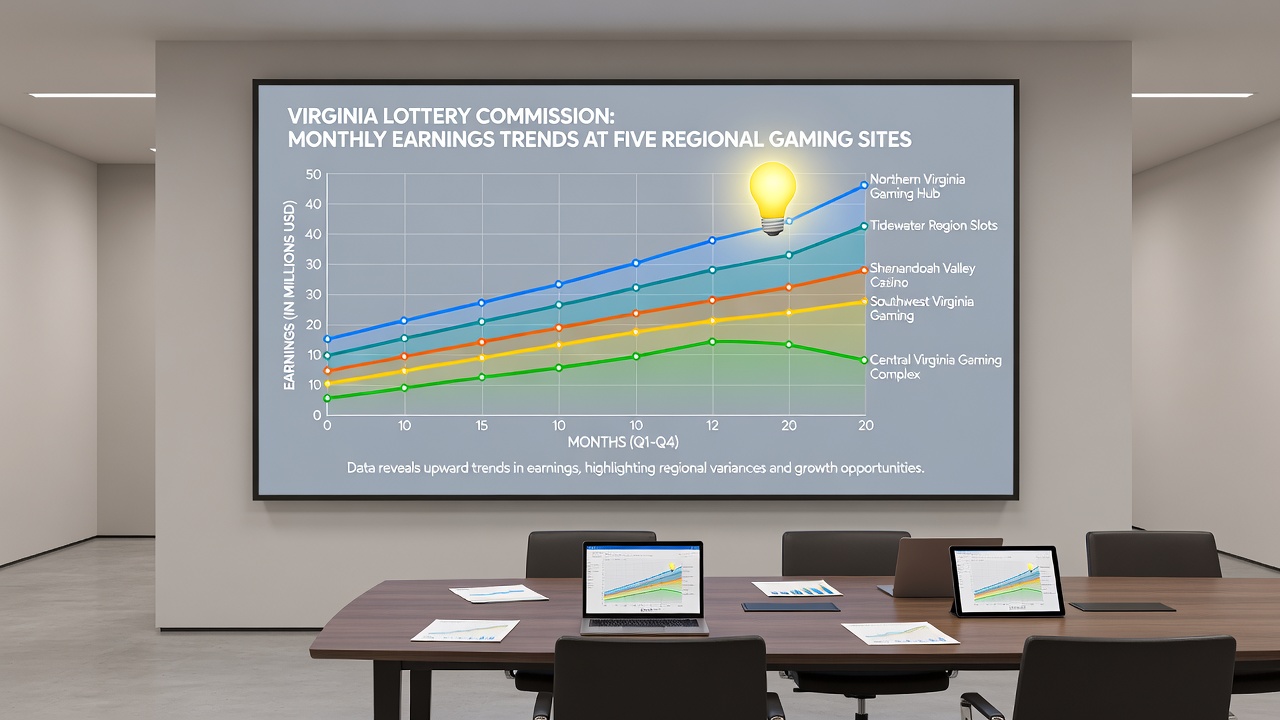
Figures released for the period leading into July 2026 indicate combined revenue from the five locations reached several hundred million dollars in recent months, with individual sites posting gains or dips based on specific operational adjustments. Bristol's Hard Rock Hotel and Casino recorded consistent month-over-month changes driven by its position near state borders that attract cross-state visitors, while Danville's Caesars Virginia showed steadier performance linked to regional marketing campaigns. Norfolk's facility maintained solid numbers through its urban accessibility, and Portsmouth along with Richmond venues reflected variations connected to local event schedules and infrastructure improvements.
Commission documentation breaks down slot machine revenue separately from table games, and this separation reveals how certain locations lean more heavily on one category over the other. Electronic gaming devices account for the larger share at most sites, yet table game sections at Bristol and Richmond have posted incremental growth during peak travel periods.
Site-by-Site Earnings Breakdown
Bristol continues to lead in total revenue among the group, though its monthly swings appear more pronounced during holiday stretches when visitor traffic spikes. Danville's operation shows tighter consistency, with smaller percentage shifts month to month that analysts attribute to its focus on loyalty programs and repeat local patronage. Norfolk's venue posted moderate increases tied to downtown revitalization efforts, whereas Portsmouth experienced brief dips followed by recoveries once new transportation links opened.
Richmond's casino maintains a balanced profile where earnings from both slots and tables track closely with broader regional employment data. Commission staff compile these numbers through mandatory filings that each operator submits by set deadlines, creating a standardized dataset for comparison across all five locations.
Factors Shaping Monthly Trends
Weather patterns, major sporting events and nearby construction projects all surface in the commission's accompanying notes as elements that can influence foot traffic. Data from early 2026 quarters already highlighted how winter storms briefly reduced attendance at northern sites, while spring festivals boosted numbers at coastal locations. Those monitoring the reports point out that promotional calendars at each property also play measurable roles in smoothing out revenue curves.
Statewide tourism statistics from the Virginia Tourism Corporation align with several of these monthly shifts, providing additional context for why certain periods outperform others. Economic indicators such as unemployment rates in surrounding counties further correlate with attendance at the more locally oriented venues.
Comparative Analysis of Revenue Categories
Slot revenue dominates across all five sites, yet the proportion varies noticeably. Bristol allocates a larger percentage of floor space to high-denomination machines, which contributes to higher per-unit earnings during busy stretches. Danville and Norfolk maintain broader mixes that include more penny and nickel denominations, resulting in steadier daily play volumes even during slower weeks.
Table game revenue shows stronger seasonal sensitivity at Richmond and Portsmouth, where poker rooms and blackjack pits respond quickly to changes in regional disposable income. Commission data includes hold percentages and average daily win per unit, giving operators and regulators clear benchmarks for performance evaluation.
Regulatory Context and Reporting Standards
Virginia's regulatory framework requires detailed monthly submissions that undergo verification before public release, and this process ensures consistency across operators. The commission publishes aggregated summaries alongside individual venue breakdowns, allowing direct comparisons without disclosing proprietary operational details. External reviews from organizations such as the American Gaming Association have referenced similar state-level datasets when examining regional market maturity.
Those studying these patterns note that Virginia's approach mirrors reporting methods used in other East Coast jurisdictions, though each state tailors categories to its own mix of games and facilities. July 2026 updates are expected to incorporate any new tax allocation figures tied to the most recent earnings cycle.
Conclusion
Commission data continues to provide a clear window into how Virginia's five gaming sites navigate monthly earnings variations, with each location displaying unique responses to visitor flows, local conditions and operational choices. Ongoing releases will track whether current trends hold or shift as additional infrastructure and marketing initiatives take effect across the state.